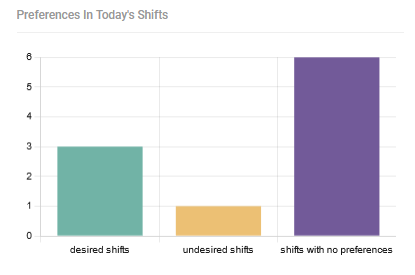
In this section of the Overview page, a bar chart visually represents the distribution of employees’ preferences for today’s shifts. It displays the percentage of shifts with assignments that match employees’ desires, those that are undesired by employees, and shifts with no specific preferences.


